UK Freshwater Ecology Is in Crisis
Atlantic salmon populations have collapsed by 63% in three generations. The European eel — once so abundant it was considered a pest — is now critically endangered, its UK numbers down 95% in twenty-five years. The vendace, Britain's rarest freshwater fish, survives in just two lakes. The Allis shad clings to a single spawning site on the River Tamar. Water voles have disappeared from 94% of their former range. Great crested newts — protected under the Habitats Regulations and the trigger for countless planning delays — are declining in ways that current monitoring simply cannot track at scale.
One in six species assessed in the UK is now at risk of extinction. Freshwater habitats are the hardest hit — supporting over 10% of all known species while covering less than 1% of the Earth's surface. The State of Nature report is unambiguous: the UK has less than half of its biodiversity remaining, and the decline has not slowed.
The Data Gap
The response to this crisis is limited by a single, structural problem: we don't know what's out there. Not in real time. Not at the resolution required. Not across the species range that matters.
Existing monitoring relies on annual surveys, volunteer recording schemes with months-long verification queues, and datasets that are fragmented across dozens of organisations with incompatible formats. A rivers trust in Devon doesn't know what a wildlife trust in Norfolk is recording. A local authority assessing a planning application can't access the same species data that the Environment Agency holds for the same catchment. The data exists — scattered, siloed, and slow.
Conservation without data is guesswork. Licensing without evidence is politics. Planning without baseline ecology is negligence. Every decision-maker in UK freshwater management — from Natural England licensing officers to rivers trust catchment coordinators to water company environmental managers — faces the same problem: they need comprehensive, verified, current ecological data, and the infrastructure to collect it at scale doesn't exist.
That's What This Platform Is For
Hydroscape is not a recording app. It is a complete ecosystem for generating, verifying, analysing, and acting on freshwater ecological data — from the moment a volunteer photographs a species on their phone to the moment a 4-page professional biodiversity report lands on a planning officer's desk. AI species identification. Automated verification. 9-metric ecological analysis. Water quality indexing. 3D terrain mapping. Append-only audit logging. Built on independently-audited security infrastructure (see our security section below).
What follows is the professional intelligence layer for organisations — the ecological analysis, water quality indexing, and evidence tools built on top of the citizen-science recording layer. The free tools that feed it (AI species identification, the HydroLibrary, the live dashboard) are described further down, after the professional platform.
For Organisations
Hydroscape's professional intelligence layer is designed for rivers trusts, wildlife trusts, conservation charities, water companies, local authorities, and fishery management bodies who need to turn raw sighting data into defensible ecological analysis. BioMapper for 9-metric biodiversity metrics. HydroSonde for continuous water quality indexing. A branded 4-page PDF report that meets the evidence standard for planning, licensing, and board-level reporting.
The underlying citizen-science recording layer — AI-assisted identification, the HydroLibrary species database, and the live public dashboard — is free and open to everyone, including your volunteers. Everything below describes the organisational tools first; the free layer that feeds them is covered further down the page. Request a demo and we'll walk through the full platform with your geography and your data.
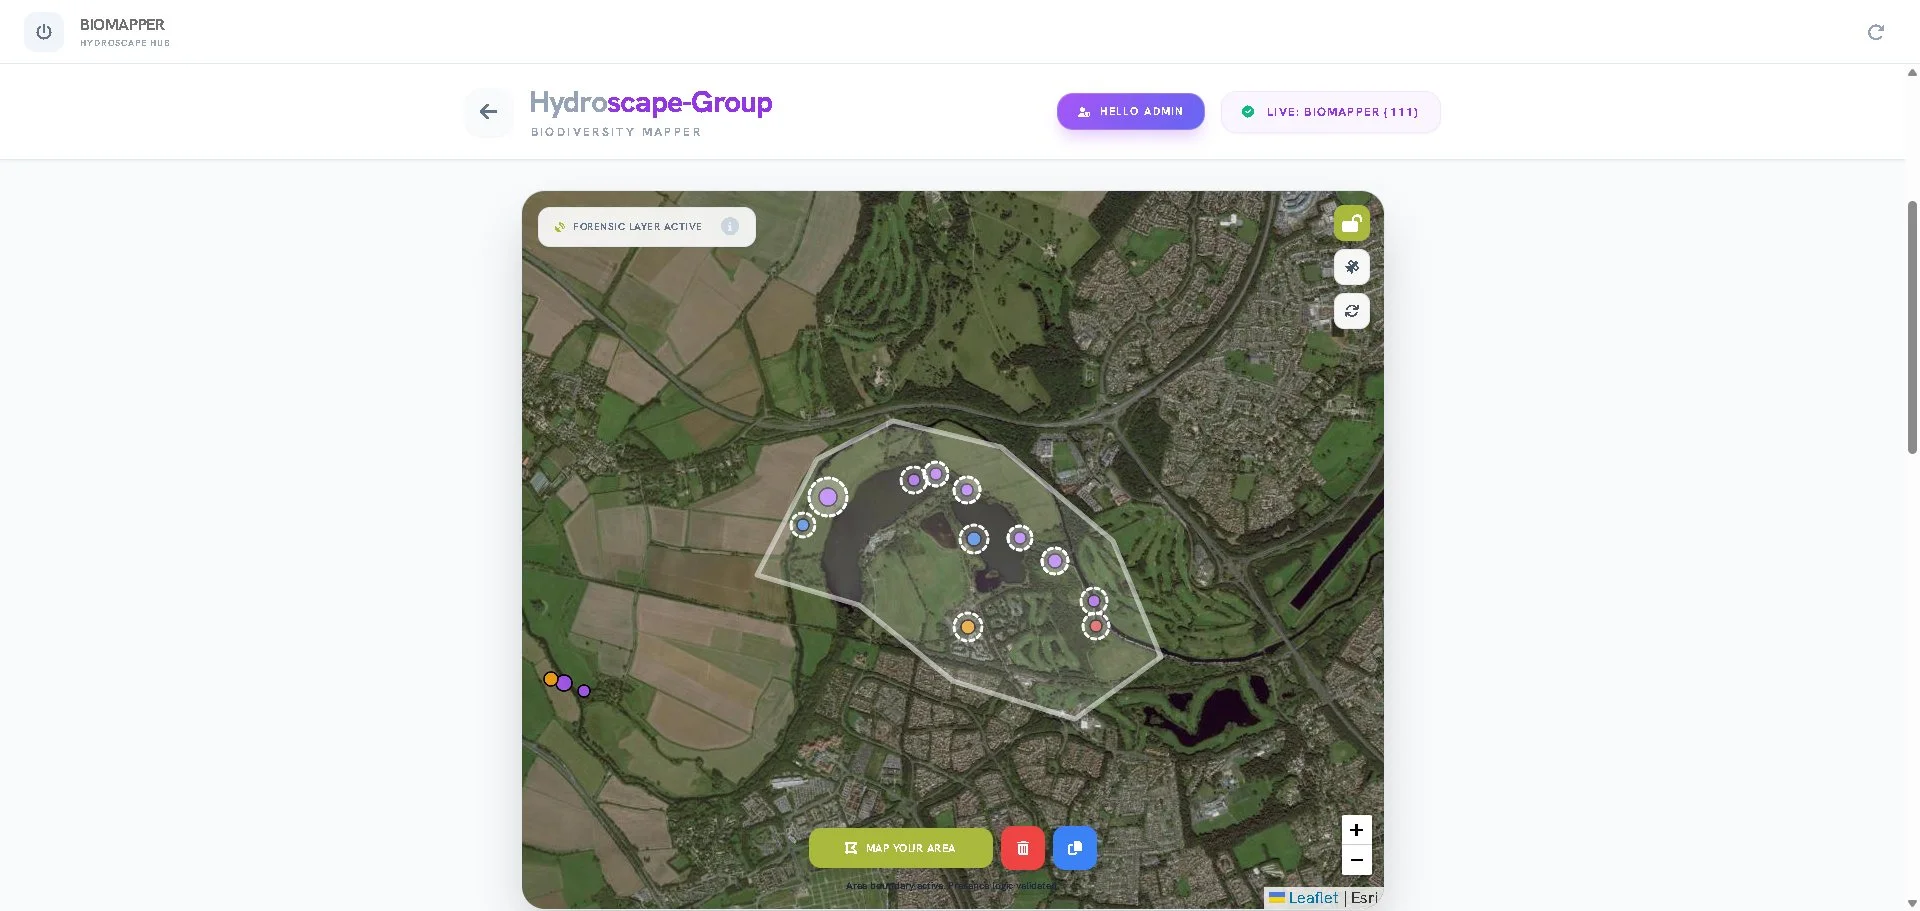
3D Terrain Explorer
Every sighting is visible in the 3D terrain explorer — a full three-dimensional map where you can fly over any region, see sighting density from altitude, and generate automated flyover videos. Cormorant roosts along a river valley. Biodiversity hotspots in a national park. Water quality reports across a chalk stream. All rendered in real terrain with real data.
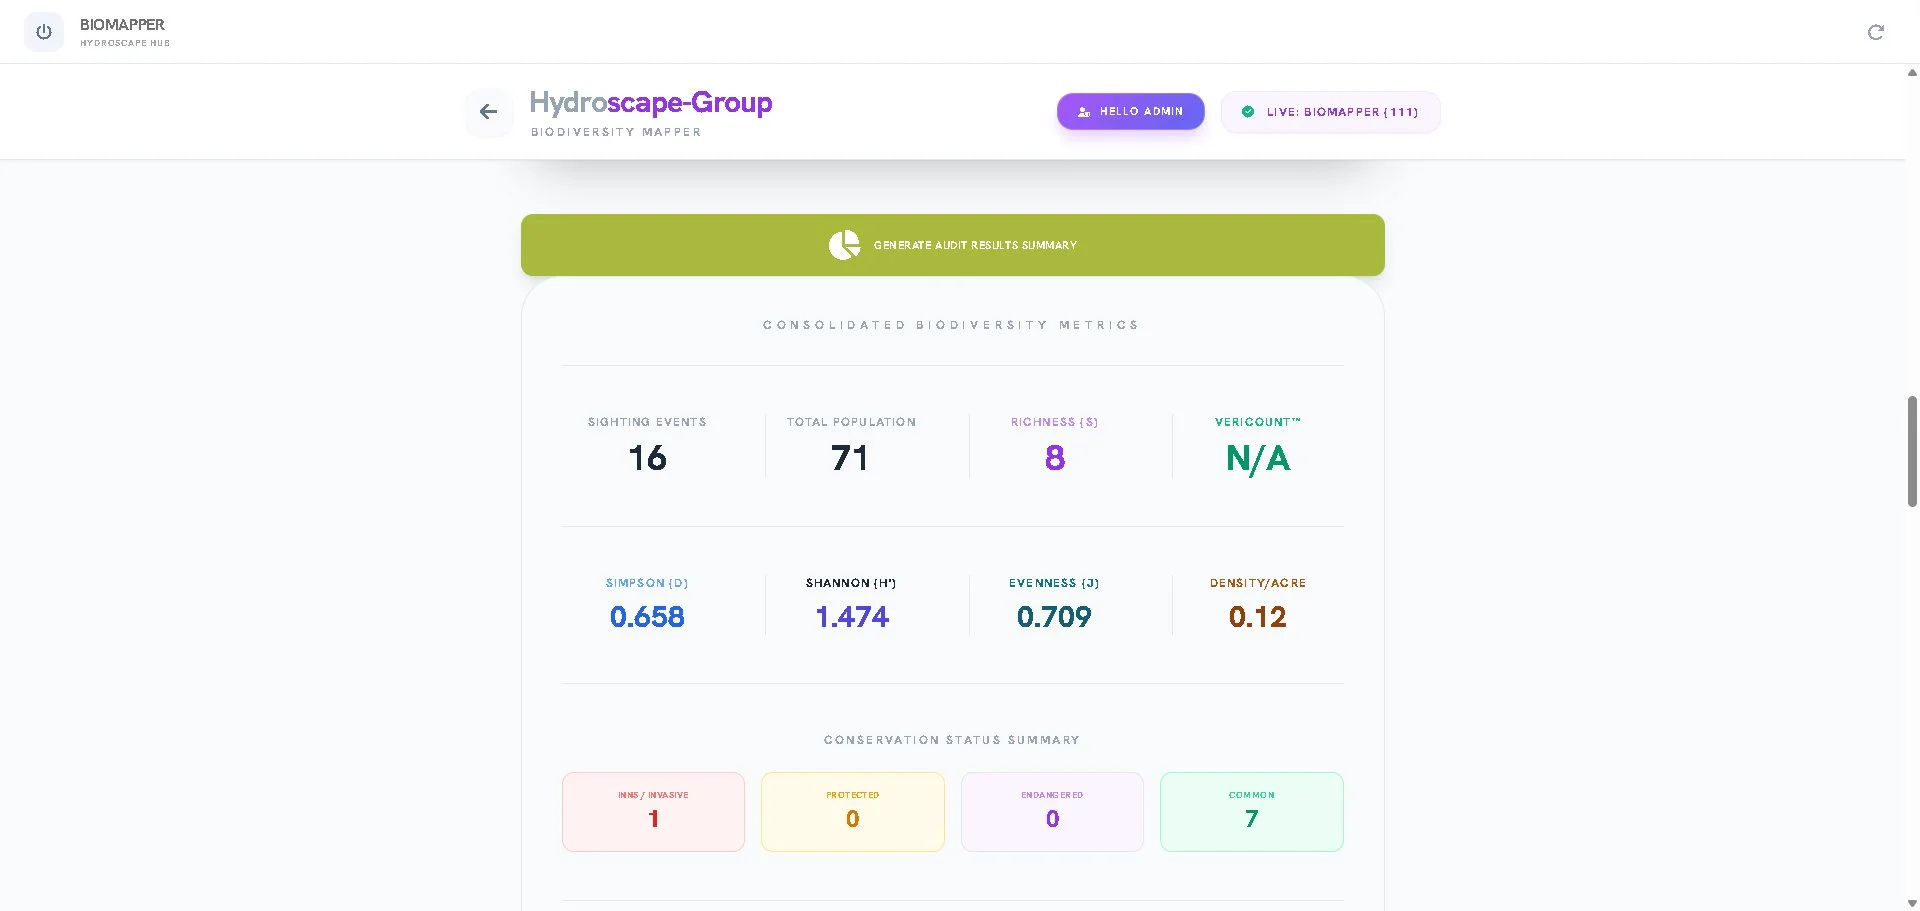
BioMapper™ — 9-Metric Biodiversity Analysis
This is where the data earns its keep. The sightings you submit don't just sit on a map. They feed into BioMapper — a zone-based ecological analysis engine that calculates nine professional biodiversity metrics from your sighting data.
These are the metrics that ecological consultants typically calculate manually for a Biodiversity Net Gain (BNG) assessment or an environmental impact study — the kind of work that now sits on every planning application in England under mandatory BNG legislation (February 2024 onwards). BioMapper generates them automatically, from your own sighting data, for any zone drawn on the map.
Professional PDF Reports
BioMapper exports a branded 4-page PDF report that can be submitted directly to planning authorities, environmental consultants, or conservation bodies. Page one: site summary and 10-metric overview strip with site map. Page two: ecological analysis — Conservation Concern Ratio breakdown, Species Accumulation Curve with survey adequacy verdict, Diversity Trend chart with directional analysis, and full methodology section. Page three: complete species table with conservation status colour-coding. Page four: narrative summary, taxonomic distribution charts, and density analysis.
This is not a screenshot. It's a document that meets the evidence standard expected by planning authorities and licensing bodies.
HydroSonde — Water Quality Intelligence
The same depth of analysis exists for water quality. HydroSonde calculates a composite 9-factor Water Quality Index from crowd-sourced observations and optional probe data — giving rivers trusts, fisheries, conservation groups, and water companies a continuous picture of waterbody health without a chemistry lab or a £10,000 monitoring station.
Each submission returns a composite WQI score, a per-factor breakdown, and a trend line showing how the waterbody is changing over time. Seasonal charts, waterbody distribution, pollution frequency breakdowns, and branded PDF reports all sync to a secure cloud archive — ready to submit to the Environment Agency, a planning authority, or an internal board.
For the first time, fisheries, rivers trusts, and conservation groups can generate continuous water quality analytics from volunteer observations — not in six months, not once a year, but in real time.
In Practice
Your volunteers are already out in the field every month. Give them the Biodiversity Report link. Every sighting they submit is AI-verified, georeferenced, and feeds directly into your BioMapper analysis. At the end of the quarter, draw a zone around your site and export a 4-page PDF report for your board, your funder, or your planning authority. No additional training. No new app to install. No cost to your volunteers.
Data Ownership & Pricing
Your data remains yours. Export as PDF or export raw sighting data at any time. Wildlife Intelligence subscriptions for single-species monitoring start at £39 per month. Multi-species, all-access, and A06 licensing plans are also available, sized to the scope and geography you're monitoring. View full pricing →
Hydroscape is a commercially operated platform with a long-term development roadmap — not a grant-funded project with a sunset clause. It is actively developed and maintained, and will be here next year and the year after that.
Independently-Audited Security
Hydroscape scores 10.0 out of 10 against the OWASP Top 10:2025 framework — the current global standard for web application security. 172 automated assertions run against live infrastructure. Zero failures. The audit covers every security header, full Content Security Policy, multi-factor authentication, append-only audit logging, DOMPurify sanitisation on every data write, App Check attestation, and GDPR-compliant privacy-preserving rate limiting with SHA-256 IP hashing.
The audit is reproducible and the full results are available on request to qualifying organisations. Every assertion can be re-run against the live environment at any time.
Data is hosted on Google Cloud europe-west2 (London), encrypted in transit and at rest. Firebase App Check with reCAPTCHA Enterprise verifies every request is coming from a genuine app instance, not a bot or a spoofed client.
Honest About Confidence
HydroVision AI tells you when it isn't sure. Every identification comes with a confidence rating: high, medium, or low. A blurry photograph taken from 30 metres away will return a low-confidence result — and the AI will explain why. A confident wrong answer is worse than an honest "I'm not sure — here are three possibilities." That transparency is by design: users can see the model's confidence and apply their own judgement about which records to act on.
AI-Verified. Not Just Collected.
Every sighting that includes a photograph is independently verified by AI. The same species identification engine that powers HydroVision AI runs a forensic four-step verification on every image: image quality assessment, species confirmation against morphological markers, individual count with anti-duplication checks, and a confidence threshold that automatically rejects anything below the standard required for regulatory evidence.
Every record is AI-checked at submission, georeferenced, timestamped, and written to an append-only audit log. Modifications and deletions are themselves recorded as audit events, giving a full forensic history of every piece of data in the system.
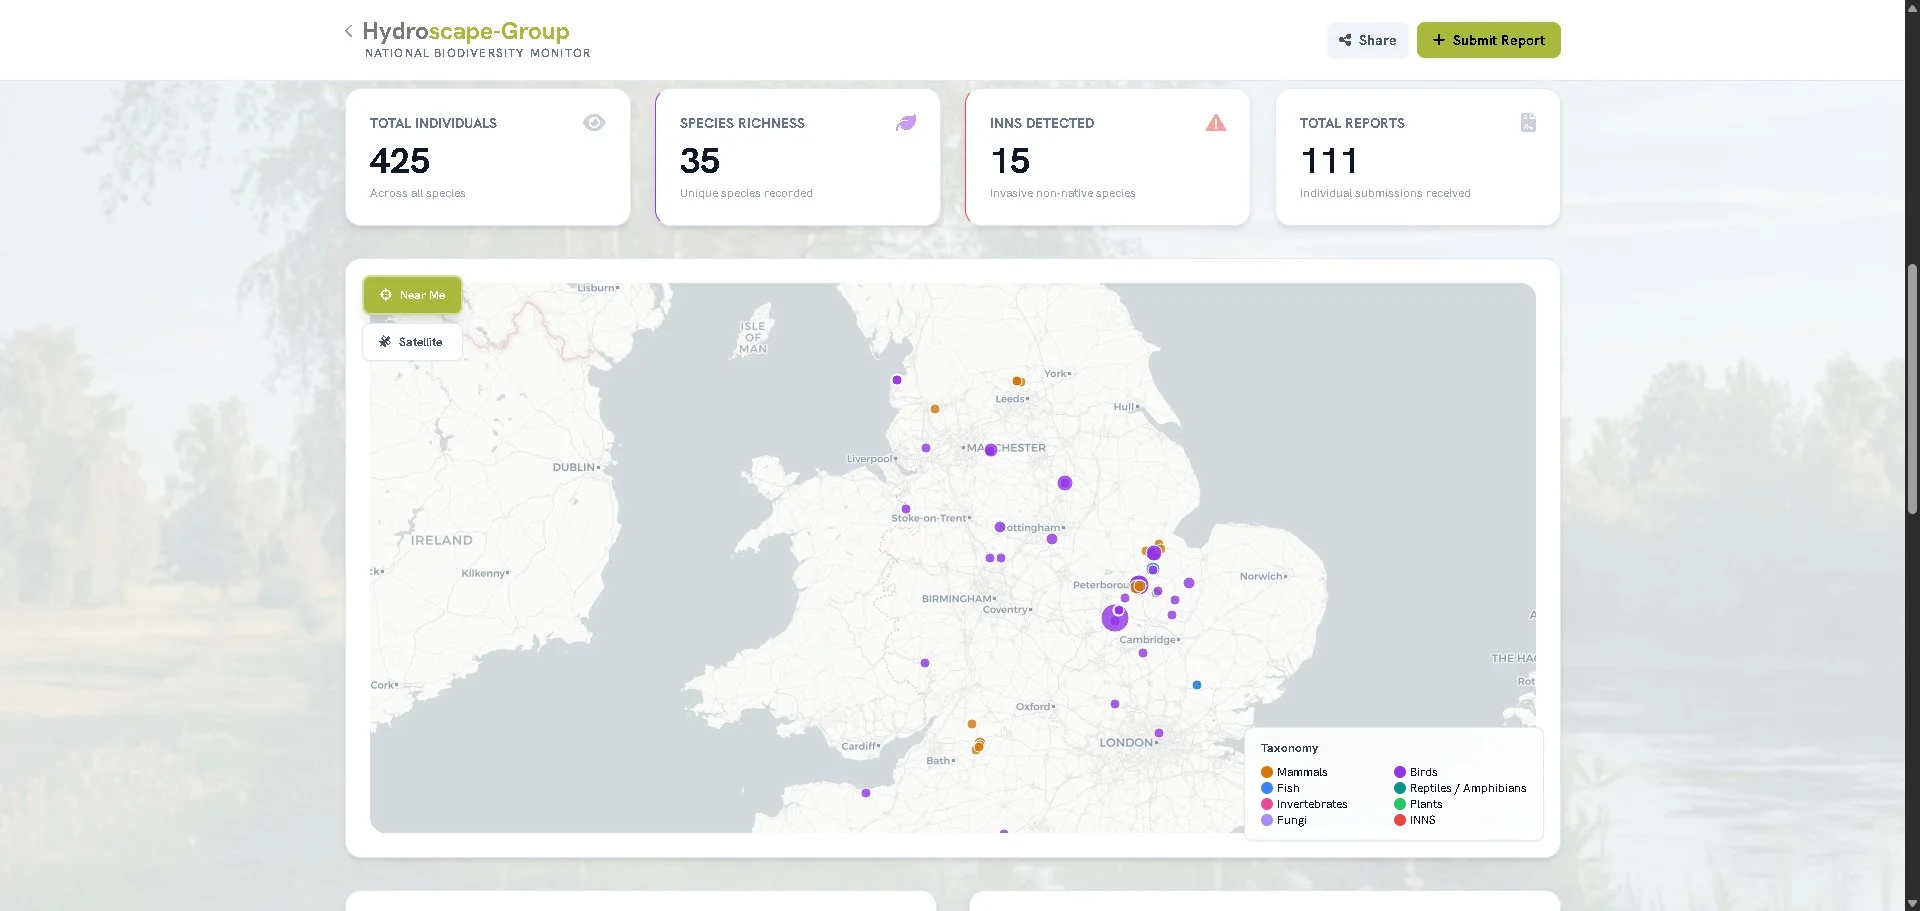
A National Map That's Always Live
Every verified sighting appears on the public dashboard — a live, interactive national map showing cormorant monitoring, biodiversity, and water quality data. Three distinct data modes. County-level breakdowns. Species filtering. Cluster mapping at every zoom level. This isn't a static report published once a year. It's a continuously updating picture of UK biodiversity that grows with every submission.
Works Without Signal
Your water doesn't have WiFi. We know. Every reporting form works offline — your submission saves on your phone and syncs automatically when you're back in range. You'll never lose a report because you were out of signal.
Who Built This
Hydroscape is designed, built, and operated by passionate fishery managers with decades of hands-on experience in water management, biodiversity, habitat improvement, and freshwater ecology. This is software written by people who have spent their working lives in waders — who understand what a bailiff's day looks like, what a trustee needs at the AGM, what a consultant has to evidence for a BNG assessment, and what a water company needs when a pollution incident breaks on a Sunday evening.
We built this because the tools that exist were built by software companies selling to a sector they don't work in. That shows — in clunky workflows, features built for a brochure rather than a riverbank, and roadmaps driven by what's easy to ship rather than what the sector actually needs. Hydroscape is the opposite: operator-built, with every form, every metric, and every workflow shaped by years of watching good data disappear into spreadsheets, fragmented recording schemes, and verification queues that take six months to clear.
When you raise a support ticket, submit a feature request, or book a demo, you speak directly to the team building the platform — not to an account manager, not to outsourced support, not to a chatbot. Hydroscape is actively shipped, week by week, in response to what users and organisations actually need.
Who Hydroscape Isn't For
Being honest about fit matters more than a bigger funnel. Hydroscape is probably not the right tool for you if:
— Your monitoring requires certified laboratory chemistry (BOD, COD, nitrate by ion chromatography, heavy metals, pesticide residue). HydroSonde indexes observational and sensor-derived water quality — it does not substitute for UKAS-accredited lab analysis.
— You need survey-grade taxonomic data for peer-reviewed research publication. AI identification is assistive; confidence ratings are honest; but data for research publication typically requires specialist expert verification beyond what HydroVision AI alone provides.
— You already have a mature GIS and ecological analysis stack (ArcGIS Pro with custom biodiversity modules, deployed data scientists, peer-reviewed internal methodologies). Hydroscape is a citizen-science platform with professional analysis on top — not a replacement for enterprise ecological GIS infrastructure.
For organisations that fit those descriptions, we'll happily recommend better-suited alternatives during the demo call. For organisations that need accessible citizen-science recording, AI-assisted identification, automated biodiversity metrics, and ready-to-submit PDF evidence without a six-figure tooling budget — that's what Hydroscape is for.
What Happens on a Demo Call
30 minutes, one video call, no pitch deck. You'll be speaking directly with the Hydroscape team — the people building the platform. No SDR, no account executive, no funnel to work through first.
We'll set up a test zone covering your geography. We'll use your species data if you have any to share, or we'll pull from the live dataset for your region. You'll see BioMapper calculate the 9 metrics in front of you, export the PDF, and we'll walk through whether what you're seeing is useful to your workflow or not.
You'll know by minute 15 whether Hydroscape is a fit for your organisation. If it's not, we'll tell you — honestly — what a better-suited tool would be and why. No follow-up sales pressure. No drip sequence. If there's a fit, we'll scope what subscription tier makes sense and how onboarding works. If not, you'll leave with clearer criteria for what you actually need.
See the Full Platform
30-minute walkthrough, tailored to your needs. We'll show you the public reporting layer, the AI verification pipeline, BioMapper, HydroSonde, and the 3D terrain explorer — with your data, on your geography.
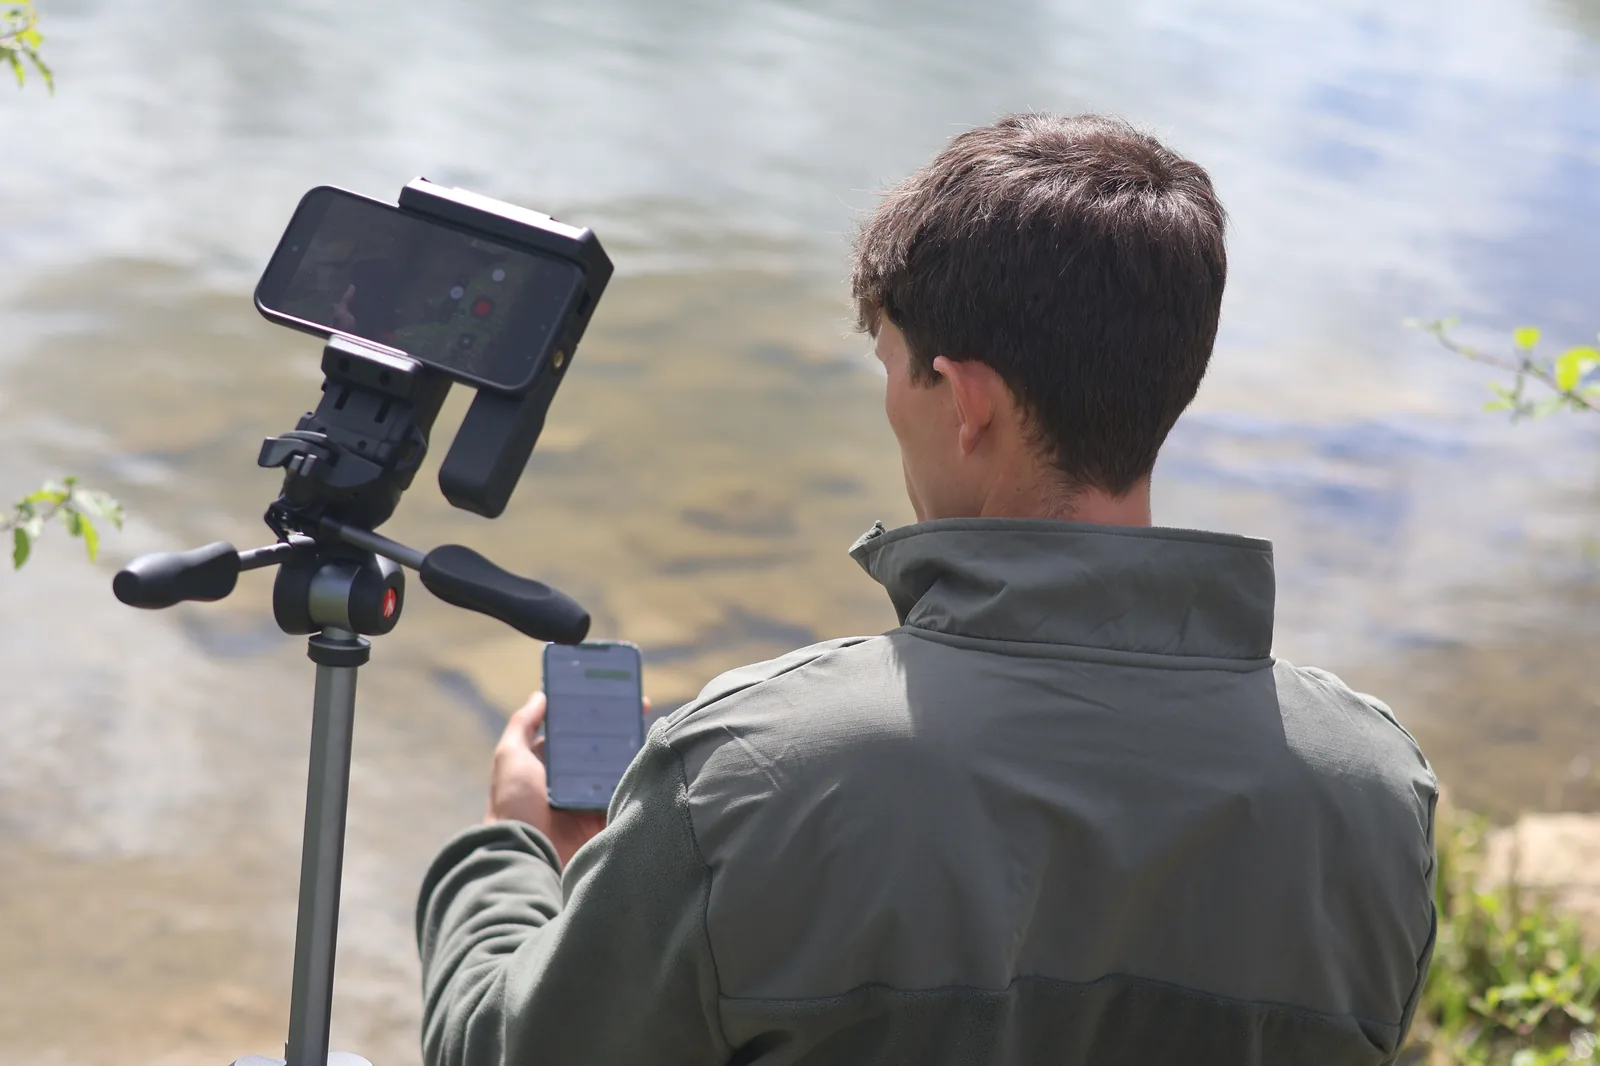
You heard something in the hedge. A song you don't recognise. You saw a flash of colour on the bank — too quick for a good look, too distinctive to ignore. A shape in the water that wasn't a duck. A moth on the window. A mushroom at the base of an oak. A tree you've walked past a hundred times and never been able to name.
That moment — the one where curiosity meets uncertainty — used to end with a shrug. Now it ends with an answer.
This is HydroVision AI — part of the Hydroscape Ecosystem, a freshwater and riparian biodiversity toolkit for reporting, identification, and professional ecological analysis. Built by people who spend their lives at the water, to protect, monitor, and celebrate the ecology we all share.
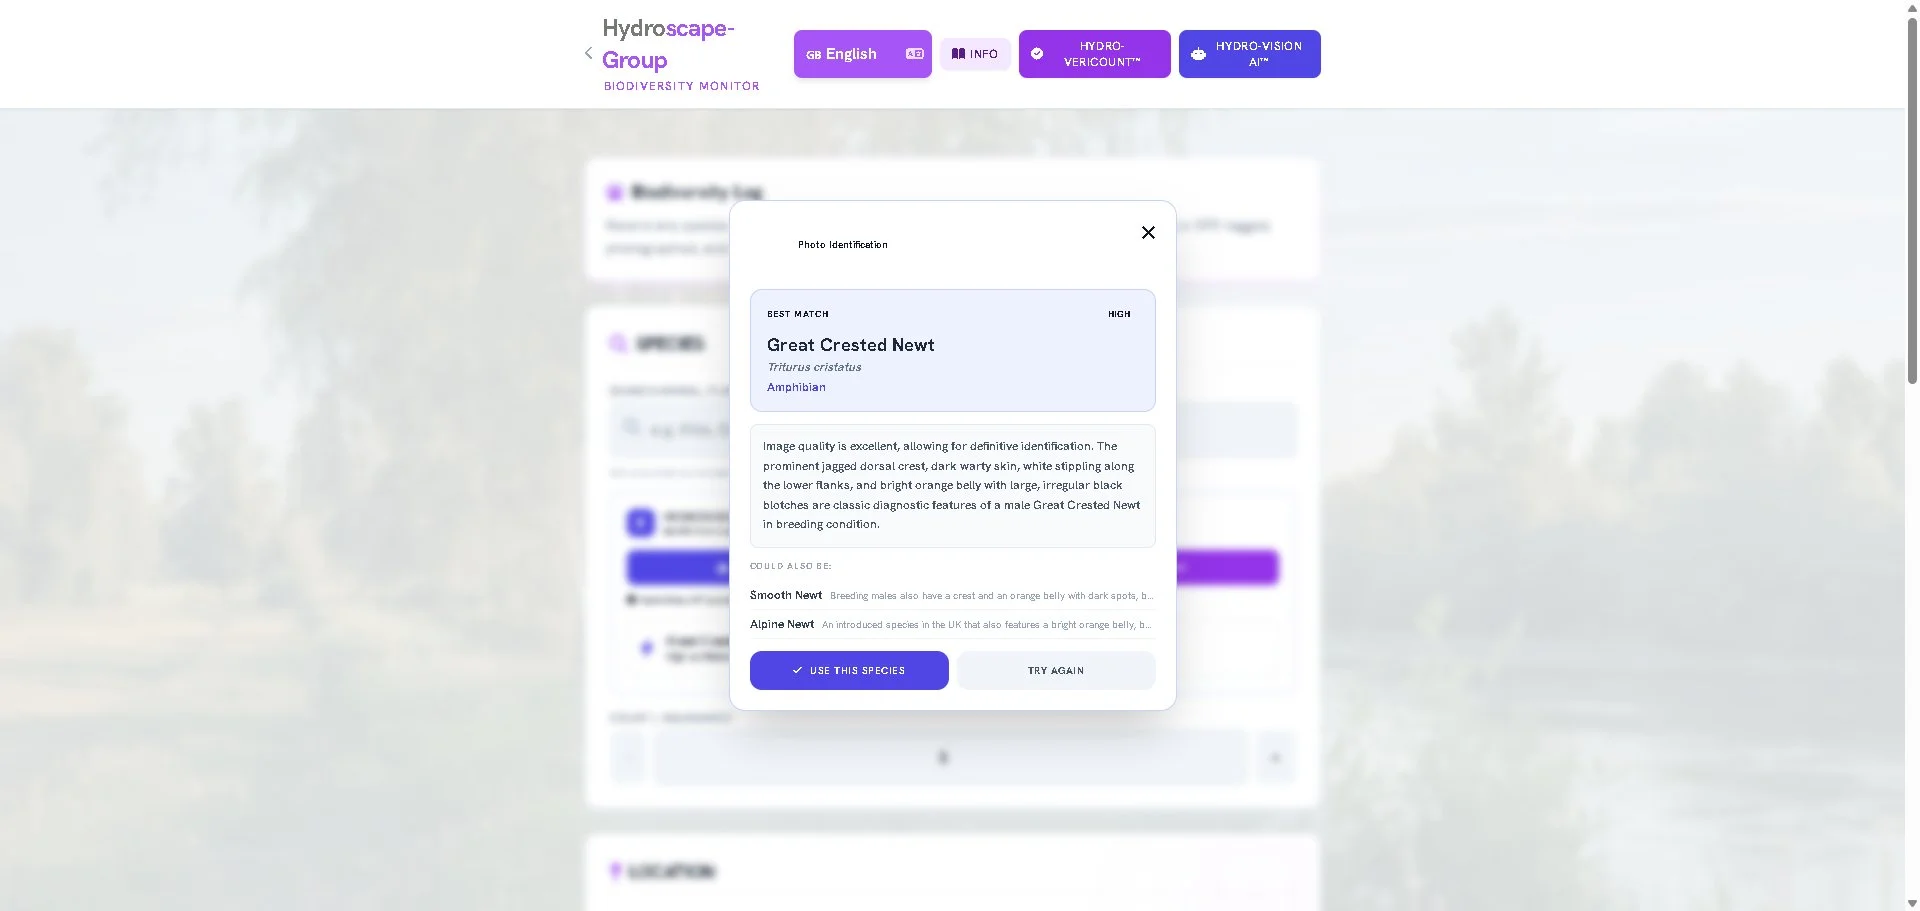
Photo Identification
Open the Biodiversity Report on your phone. Tap the HydroVision AI button. Take a photograph — or choose one from your gallery. The image is sent to a species identification engine with a UK-focused training dataset and broad international species overlap. Within seconds you'll see the species name, the scientific name, a confidence rating, and up to three alternatives it could be confused with.
It works on birds, mammals, fish, amphibians, reptiles, invertebrates, plants, trees, and fungi. That reed warbler you've never been sure about. The damselfly that could be one of a dozen species. The bracket fungus on the fallen willow. The wildflower in the meadow margin that you know you've seen before but can't place. All of them.
Sound Identification
Can't see it? Record it. Tap the microphone button, hold your phone towards the sound, and let it listen. Birdsong, amphibian calls, insect stridulation — the AI analyses the audio and identifies what's making the noise. A dawn chorus becomes a species checklist. That warbler you've never been able to name finally has a name.
The recording stays on your phone. Play it back, check the result, and if you choose, submit it as a verified biodiversity record — with the audio as evidence.
Photograph it or record it.
Open the Biodiversity Report on your phone. Tap HydroVision AI. Take a photo of what you can see — or hit the red microphone button and let your phone listen to what you can hear.
Get your answer.
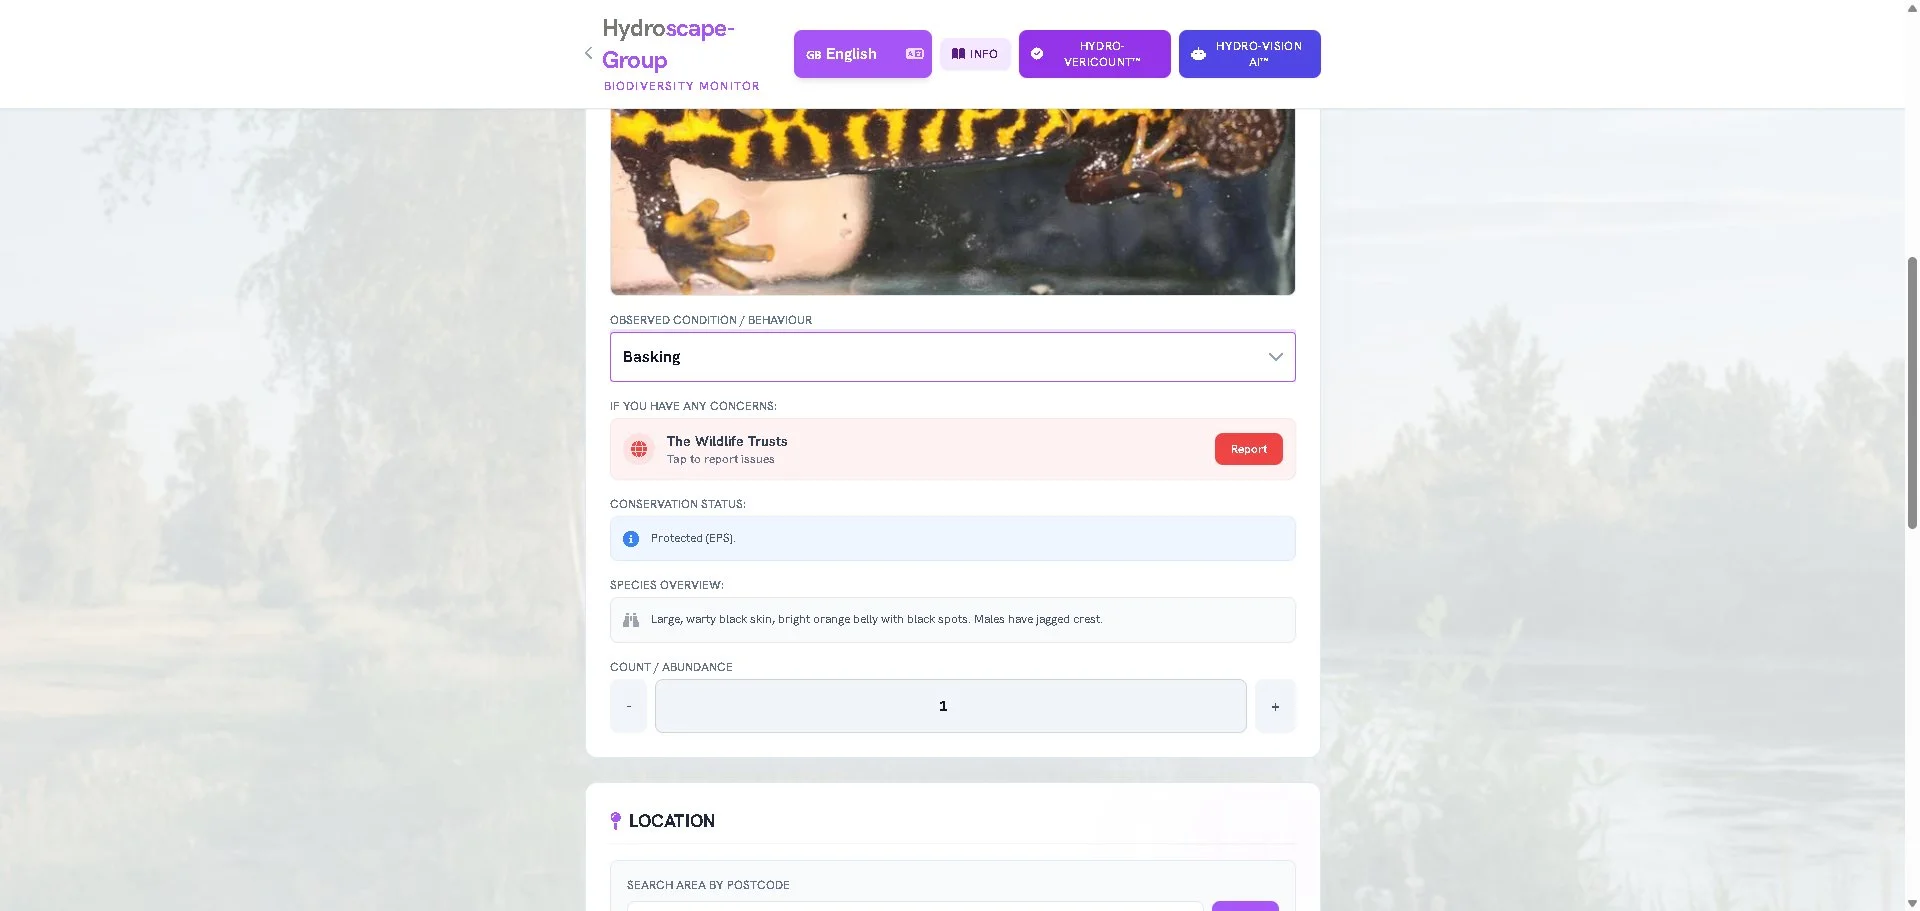
Species name. Scientific name. Confidence level — high, medium, or low. Up to three alternatives with explanations for why they could be confused. If the species is in the HydroLibrary, the matching profile opens automatically — conservation status, habitat, legal protections, and a direct link to the right authority if it's protected or in trouble.
1,004 Species. 1,066 Images. Everything You Need to Know.
HydroVision AI doesn't exist in a vacuum. Behind every identification sits the HydroLibrary — an open, free reference database for freshwater and riparian species, currently UK-focused with broad international overlap. 1,004 detailed species profiles covering birds, mammals, fish, amphibians, reptiles, invertebrates, plants, trees, and fungi. 22 authority profiles with direct reporting links. 20 habitat management guides. 18 water quality reference entries. 5 deterrent method analyses. Every profile includes conservation status, legal protections, ecological role, identification features, and a direct link to the relevant authority — whether that's the Environment Agency, Natural England, the RSPB, a specialist trust, or a local wildlife rescue.
You don't need HydroVision AI to use the library. You don't need to be outside. Open it at home, at your desk, on the train. Search by name, filter by category, browse by conservation status. Planning a walk along a chalk stream? Check what you might encounter before you leave the house. Teaching a class about freshwater habitats? Pull up the species profiles and project them on the board. Managing a site and need to know what's protected? Filter by Red List or Schedule 1 and get instant legal context. Curious about the tree at the end of your road? Look it up.
The HydroLibrary is a biodiversity education resource as much as it is a reporting tool. It exists for anyone who wants to understand the environment around them — no expertise required, no login, no cost, no restrictions.
22 Languages
Every species description in the HydroLibrary is available in 22 European languages. English, French, German, Spanish, Polish, Romanian, Dutch, Italian, Portuguese, Czech, Hungarian, Lithuanian, Slovak, Bulgarian, Latvian, Estonian, Danish, Swedish, Finnish, Greek, Croatian, and Slovenian. A Polish angler on the Trent. A conservation group in Lyon. A Romanian volunteer in Norfolk. A rivers trust in Bavaria. The species data is in their language. The platform works wherever they are.
Try It Now
Open the Biodiversity Report on your phone. Tap HydroVision AI. Point your camera at the nearest living thing — a houseplant counts. See what comes back.
Identification Is the Bottleneck
The biggest barrier to ecological monitoring at scale isn't funding or technology. It's identification. Millions of people walk, fish, paddle, and work alongside UK freshwater habitats every week. They see biodiversity every day. They don't report it because they're not sure what they're looking at. A kingfisher is obvious. A reed warbler isn't. A pipistrelle bat is a shape in the dusk. A damselfly could be one of a dozen species. A great crested newt looks a lot like a smooth newt unless you know the difference.
HydroVision AI removes the bottleneck. Every one of those people becomes a potential recorder — not because they've been trained, but because the AI handles the identification and routes them to the right authority. The dataset that no single organisation has the resources to build alone becomes buildable by everyone, together.
From Identification to Action
Identifying a species is useful. Knowing what to do about it is powerful. When HydroVision AI identifies a species in the HydroLibrary, it doesn't just show you a name — it shows you the conservation status, the legal protections, and the reporting authority. If you've found an injured otter, you'll see the relevant wildlife rescue. If you've spotted an invasive signal crayfish, you'll see the Environment Agency reporting link. If you've heard a cuckoo — a Red List species whose spring arrival is tracked nationally — you'll know that your sighting has genuine scientific value.
The gap between "what is that?" and "who needs to know?" collapses to a single tap. For the organisations that manage these habitats, that means verified, georeferenced, timestamped records arriving in real time — not in a spreadsheet six months later.
The Change Funnel — From One Sighting to Regulatory Action
How a single biodiversity report from your phone becomes the evidence that drives licensing, national population data, and the case for pan-European management.
Read the ArticleDon't Invest in Feelings — The Cormorant Debate
A detailed, evidence-based analysis of the UK cormorant management debate. Peer-reviewed research, FOI licensing data, and the science that both sides need to confront.
Read the ArticleHydroLibrary — 1,004 Species Reference
Birds, mammals, fish, amphibians, reptiles, invertebrates, plants, trees, fungi. Conservation status, identification features, habitat, legal protections, and authority reporting links for every entry. Available in 22 languages.
Explore the LibraryStart Reporting — It Takes 30 Seconds
Every report builds the dataset. Cormorant sightings, biodiversity observations, water quality assessments — pick the form that fits what you've seen and submit it from your phone. No app, no login, works offline.
Open Reporting Forms